
Case study 11 min read
Nine people to two, and output went up
Four months of measured production on one account: nine people on nine devices became two people on two devices, monthly usable output more than doubled, and cost per usable piece fell 3.99×.
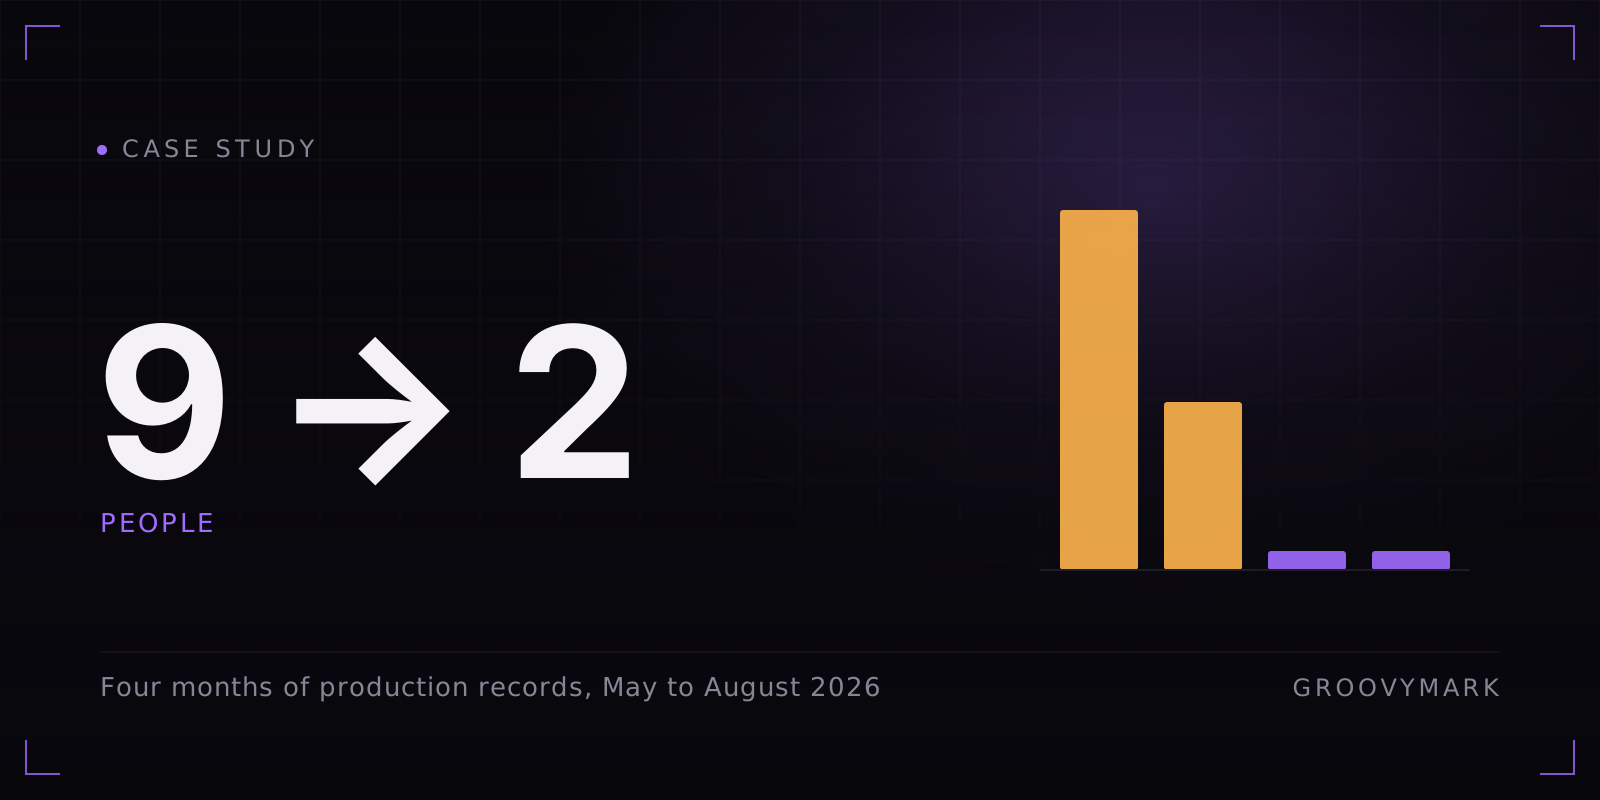
Most efficiency claims in this market have no before. A vendor arrives after the fact, measures the system they sold you, and compares it against a number somebody remembered. We have the before on this account because we ran it: nine people producing content by hand for an online assessment platform in the USA, on our own payroll, for months, until we built the pipeline that replaced most of that work.
This is what four months of records say. May is the full nine-person operation. June is the transition. July and August are the system running. Every figure below comes from cost records, output counts and review decisions on that one account, and the figures that are estimates rather than measurements are named as such at the end.
- Cost per usable piece was $12.48 $3.13 3.99× cheaper
- Human time per usable piece was 6 h 18 m 9.1 min 41.6× faster
- Right first time was 60% 98.5% +38.5 points
- Carbon per usable piece was 202 g 8.1 g 24.8× lower
The account
The client runs an online assessment platform. The content brief is unglamorous and relentless: long explainer videos on the platform’s subject matter, short vertical cuts pulled from them, and community posts to carry both into the feeds. The ratio held remarkably steady for all four months — roughly one long video to 4.3 shorts and 4.3 post sets — which is what makes month-to-month comparison worth anything.
| Pieces produced | May | June | July | August | Total |
|---|---|---|---|---|---|
| Long videos | 40 | 56 | 56 | 56 | 208 |
| Short videos | 180 | 240 | 240 | 240 | 900 |
| Community posts | 180 | 240 | 240 | 240 | 900 |
| Total produced | 400 | 536 | 536 | 536 | 2,008 |
Volume rose 34% between May and June and then held flat. If that were the whole story it would be a modest one. It is not the story, because in May and June four pieces in ten were thrown away.
The number nobody reports
Right first time was 60% under the human operation. Not 60% of the work was bad — 60% cleared review without going back. The other 40% was scripted, voiced, cut, reviewed, rejected, and either reworked or binned. It was paid for at full price either way.
Under the system, right first time is 98.5%. That figure is not an opinion: it comes from actual approve and reject decisions on finished deliverables — the review gates every run has to clear before anything reaches a queue.
Pieces produced, split by what cleared review
Bar length ∝ pieces · max 536
Every piece is weighted equally here — a long video counts the same as a community post. Crude, but the production ratio held all four months, so the months stay comparable.
Counting only what survived review, monthly usable output went from 240 to 528. It more than doubled while the team shrank by seven people. Every cost figure in this case study is priced per usable piece for that reason. Reporting cost per piece produced and accuracy separately lets a reader quietly forget to multiply them together, and the whole argument lives in the multiplication.
Where the money went
Total spend across the four months was $9,028.65. Salaries and premises took two thirds of it. The AI tooling that replaced most of that work took under a third.
| Cost | May | June | July | August | May → now |
|---|---|---|---|---|---|
| Monthly cost | $2,995.71 | $2,725.94 | $1,653.50 | $1,653.50 | 44.8% less |
| Per piece produced | $7.49 | $5.09 | $3.08 | $3.08 | 2.43× cheaper |
| Per usable piece | $12.48 | $8.48 | $3.13 | $3.13 | 3.99× cheaper |
| Per long-video cluster | $74.89 | $48.68 | $29.53 | $29.53 | 2.54× cheaper |
The gap between the two middle rows is the whole point. Flat cost per piece produced fell 2.43×, which is a decent result and the number most vendors would print. Cost per piece you can actually publish fell 3.99×, because the old operation was also paying to make the 40% it threw away.
Because the production ratio held, each long video anchors a cluster of roughly nine other pieces. A cluster cost $74.89 to make in May and costs $29.53 now — while clusters per month rose from 40 to 56.
The measure that survives scrutiny
Cost per piece can always be dismissed as the result of a smaller payroll, and on this account that dismissal has real force: most of the saving did come from headcount. Output per person-hour cannot be dismissed the same way, because volume went up at the same time.
Nine people needed 1,512 hours to produce 240 usable pieces. Two people now need 80 hours to produce 528.
Person-hours consumed per month
8-hour days · max 1,512 h
The two people in July and August are the operator running the pipeline and the client's own editor producing long videos. The client's hours are counted against our result deliberately — leaving them out would report 74× instead of 41.6×, and would not be a like-for-like comparison.
That last note matters more than the headline. The system does not make the long videos. Those 56 a month are still cut by hand, along with their thumbnails, and every hour of that work is counted on the automated side of this comparison. The figures below would all look better if we excluded it. They would also be worthless.
| People and time | May | June | July | August | May → now |
|---|---|---|---|---|---|
| People | 9 | 4 | 2 | 2 | 7 fewer |
| Devices | 9 | 4 | 2 | 2 | 7 fewer |
| Calendar days used | 21 | 22 | 5 | 5 | 4.2× faster |
| Person-hours | 1,512 | 704 | 80 | 80 | 18.9× fewer |
| Time per usable piece | 378 min | 131 min | 9.1 min | 9.1 min | 41.6× faster |
| Usable pieces per person-hour | 0.16 | 0.46 | 6.60 | 6.60 | 41.6× more |
Calendar time collapsed alongside it. A month’s output took 21 working days in May and takes 5 days now, because the pipeline runs unattended overnight and at weekends and is not bound to a shift pattern.
Nine devices drawing power, or two
The device roster is the part of this that surprised the client. Nine people meant nine machines: three workstations, three tablets, three desktops, all drawing power through a working month, in an office that also had to be lit and cooled. The system runs on one headless PC, alongside the client’s own editing workstation.
| Energy | May | June | July | August | May → now |
|---|---|---|---|---|---|
| Devices | 9 | 4 | 2 | 2 | 7 fewer |
| Electricity | 136.40 kWh | 65.23 kWh | 12.08 kWh | 12.08 kWh | 91.1% less |
| Carbon | 48.42 kg | 23.16 kg | 4.29 kg | 4.29 kg | 44.13 kg saved |
| Per usable piece | 202 g | 72 g | 8.1 g | 8.1 g | 24.8× less |
Monthly consumption fell 91.1%. Per usable piece it fell 24.8×, and the extra distance between those two numbers is the discarded 40% again: the old setup spent power on work nobody ever saw. Converted at 355 g CO₂e per kWh, the saving is 44.13 kg a month, or 530 kg a year if every month looks like this one.
Only one figure in this entire review is instrumented: the measured 5.48 kWh drawn by the automation PC, read off its own energy counters. Every workstation, desktop and tablet draw is a researched average. That distinction is set out in full below, and it matters more than any multiplier on this page.
What is measured, and what is not
- The 60% accuracy figure is an internal estimate. The 98.5% comes from real approve and reject decisions on finished work. The two are not measured the same way, and the accuracy-adjusted comparison rests on the weaker of them.
- The adjustment assumes discarded work, not rework. If the team absorbed its rework inside the same month and the same salaries, cost per usable piece overstates the money gap and May's true figure sits somewhere between $7.49 and $12.48. The time figures hold either way, because rework hours are already inside the 1,512.
- July and August are averaged. Some August content was produced during July, so the dates costs were recorded against do not match production. Recorded totals were $2,074.63 and $1,232.37; this review uses $1,653.50 for each.
- August carries an $80 allowance for spend expected before month end, because the month was still running when the figures were taken.
- Payroll and premises were recorded in local currency and converted at one fixed rate for all four months. That rate swung about 8% across the 90 days before the figures were taken, so those conversions carry a few percent either way.
- Only the automation PC's power is metered. June's 65.23 kWh applies researched draws to a reduced headcount — it was never measured. July's figure is assumed equal to August's, which is reasonable at identical output volume but is still an assumption.
- Carbon covers grid electricity only. It excludes commuting for nine people, office lighting and cooling, the embodied carbon of nine devices against two, and the datacentre energy behind the API calls. The first three widen the gap. The last narrows it, is not published by the providers, and is left out rather than guessed at.
- All pieces are weighted equally. A long video counts the same as a community post. The ratio held across all four months so the comparison is sound, but absolute per-piece cost is a blunt instrument.
- Most of the saving came from headcount, not tooling. The honest reading is that the pipeline made a smaller team viable at higher volume — not that tooling alone produced the saving. The current $3.13 assumes output holds at 536 a month without the old team.
What this does and does not prove
It proves that on one account, over four months, a custom pipeline let two people out-produce nine at better quality, and that the arithmetic holds up when you count the client’s own hours against it and price the waste in.
It does not prove your account will move the same distance. This client had an unusually stable content ratio, a subject matter that rewards repetition, and a team willing to be measured honestly on the way down. A brand producing twelve bespoke pieces a month with a new creative direction each time has a different problem, and we would tell you so on the call — the volume this is built for starts higher than that.
Whether a build pays for itself at your size, or whether running it on ours is the cheaper answer, is a separate and much shorter conversation. What this review does establish is the shape of the question worth asking any vendor, including us: not what does a piece cost, but what does a piece you can actually publish cost, how many person-hours went into it, and which of those numbers did you measure rather than estimate.